This is the third installment in a multi-part series examining why solar and storage assets underperform, and where investment theses most often diverge from reality. For prior installments, read Part 1 and Part 2.
Utility-scale solar generation in the U.S. has grown every year since 2006, reaching 296,000 GWh in 2025. As the installed base expands, projects are getting larger and increasingly built in lower-resource regions, introducing greater variability in underlying site conditions and system performance.
This shift is reflected in widening performance dispersion across the fleet. Assets that appear similar on paper can deliver materially different outcomes in practice, driven not only by where they are built, but by how they are operated and maintained over time.
This series focuses on those operational drivers of dispersion. In our first installment, we explored how soiling, spares, and downtime create persistent performance gaps. In part 2, we looked at vegetation management and tracker misalignment as sources of incremental loss. In this third edition, we turn to a different set of challenges, those rooted in documentation, data integrity, and design coordination, focusing on warranty readiness, sensor degradation, and alignment between geotechnical engineers and engineers of record.
Under (and all about) warranty
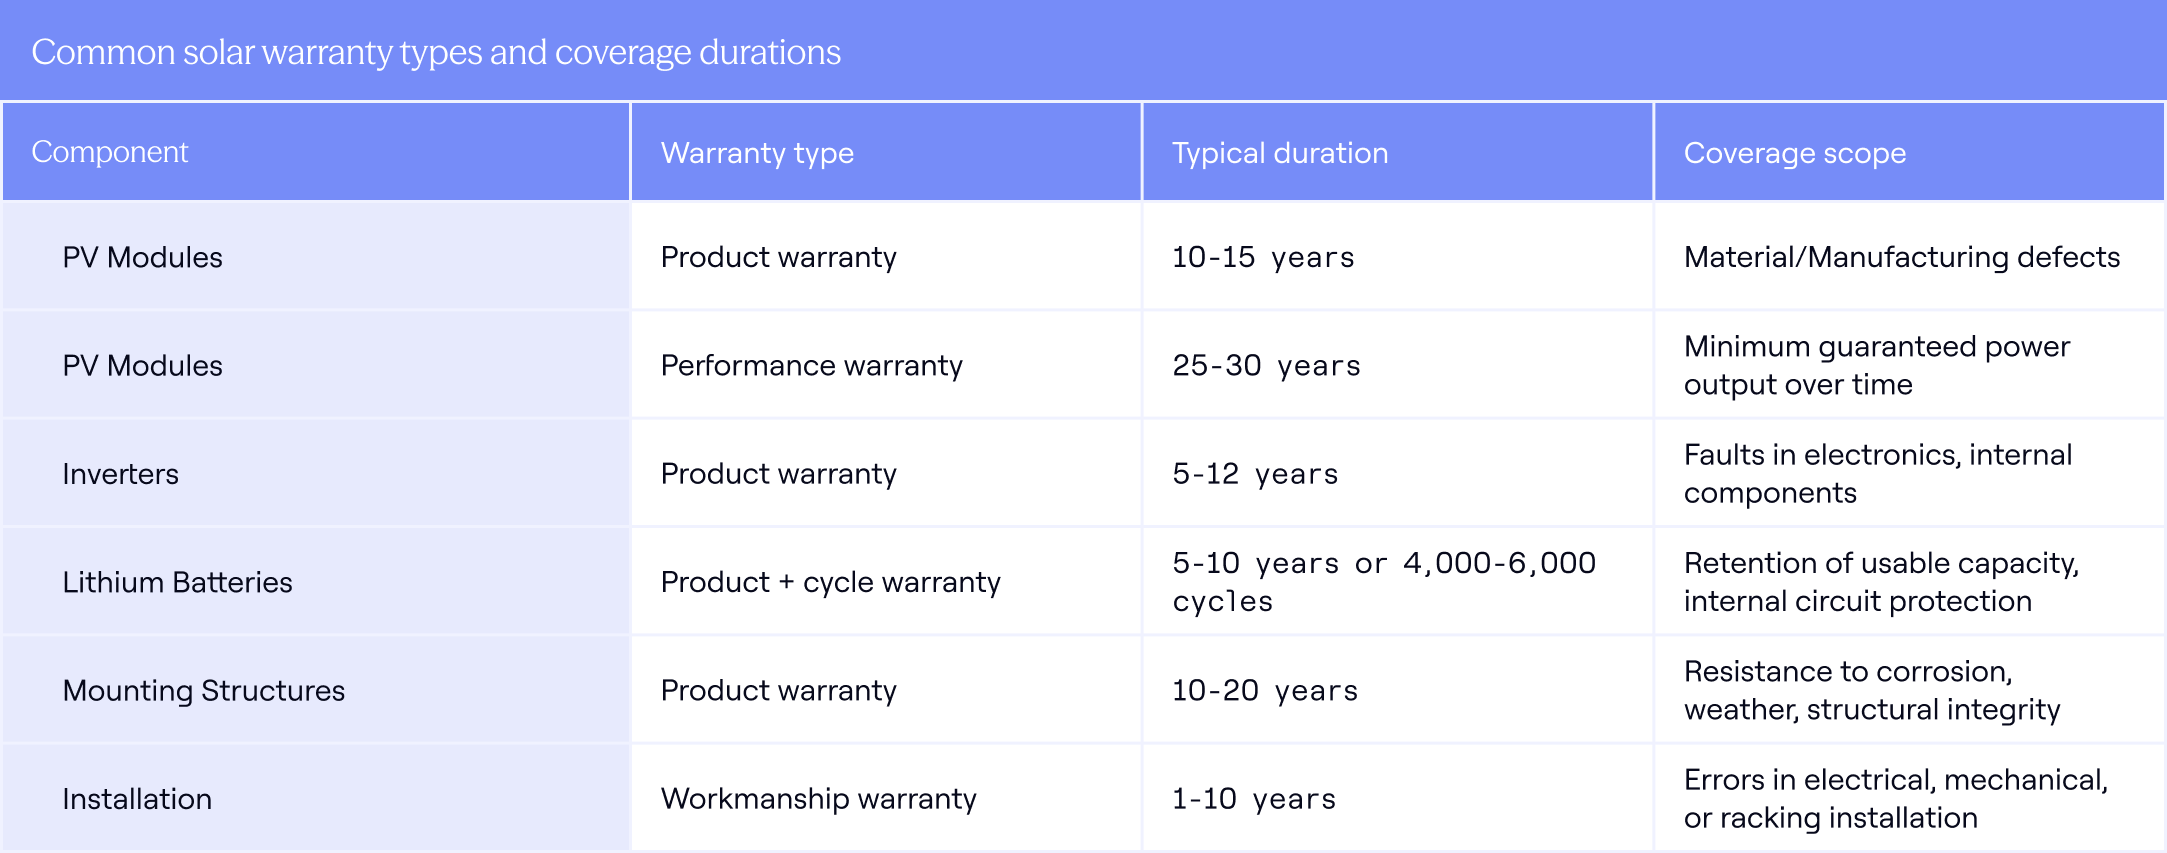
Over a 25–30 year asset life, degradation, equipment failures, and mid-life replacements are expected and explicitly modeled through assumptions for degradation rates, failure frequencies, replacement cycles, and warranty coverage. Warranties are layered onto these assumptions as a financial offset: early-life failures, manufacturing defects, and certain types of underperformance are assumed to be covered, reducing expected capital expenditures and smoothing downside risk. As we discussed in Part 1, these risks are often treated as contained and predictable: spares are assumed available, warranties are expected to hold, and failures are handled as isolated events. Because warranties are a primary mechanism through which degradation, equipment failures, and replacement costs are expected to be mitigated, models implicitly treat warranty recovery as realizable value.
In 2023, Shoals Technologies, a leading supplier of electrical balance-of-system components for utility-scale solar, disclosed $50–60 million in warranty-related expenses tied to a subset of defective wire harnesses. The issue involved insulation “shrinkback” at wire terminations, where the insulation receded from the connector and exposed conductive material, creating safety and reliability risks that required inspection and remediation across affected sites. Even in a case like this, where a defect is identified at scale and liability is clear, recovery by asset owners is not automatic.
Recovering those costs requires identifying affected assets, tracing installed components back to specific product lines or manufacturing batches, documenting the presence and extent of the defect, and submitting a substantiated claim within the applicable warranty window. This depends on assembling procurement records, EPC as-builts, and installation logs; conducting field inspections and capturing photographic evidence; and, in some cases, demonstrating safety or performance impact using operational data. If this information is incomplete or fragmented across EPCs, owners, and O&M providers, operators may be unable to prove eligibility or quantify impact, and even known defects may not translate into full cost recovery.
This gap between assumed and realized warranty value is not limited to isolated events. Across utility-scale portfolios, solar projects underperform by an average of 7–13%, and a meaningful share of those losses is attributable, identifiable, and potentially recoverable through warranties. Warranty-triggering events are not rare: inverter failure rates alone can reach up to 6% per year, creating a steady pipeline of potential claims.
Whether for a defective wire harness or an inverter, realizing value from warranty claims requires identifying issues, attributing root cause, and providing sufficient documentation within strict claim timelines.
When claims are not filed or are unsuccessful, operators must absorb the cost of repairing or replacing equipment that would otherwise have been covered, along with the associated revenue losses from underperformance. For high-value components such as utility-scale inverters, which cost approximately $47–$65/kWac, or roughly $2.3–$3.3 million for a 50 MWac project, even partial failures to recover warranty coverage can translate into hundreds of thousands of dollars in unrecovered costs at the project level.
Leading operators are ensuring warranty-readiness by:
- Track warranty start and end dates, as well as terms, for all equipment and services, and plan for additional focused inspections of equipment or systems in advance of warranty expiration. Note that warranty start dates may vary: some begin upon receipt at a warehouse or on site, while others are tied to major project milestones such as energization or COD.
- Perform preventative maintenance regularly, at least annually or as required by manufacturer recommendations, and ensure all relevant defects and issues are documented and reported. These records may support initiating a warranty claim, RMA, or similar action. Applying causal analysis methods to determine the root cause of identified defects or equipment failures prior to warranty expiration can help establish whether a claim should be covered by a vendor or manufacturer.
- Maintain awareness of warranty conditions and exclusions for all major equipment, including the obligation for notification to a vendor or manufacturer, basis for determination the disposition of warranty claims, and requirements for endemic/epidemic failure. Utilizing a comprehensive equipment submittals register, including shop drawings, along with a robust record drawing process during design and construction, can improve visibility into installed materials and conditions.
- Ensure compliance with transferability requirements, including the ability to reassign warranties in the event of an asset sale. Avoid actions that may void warranties, such as using uncertified installers, failing to perform required maintenance, or making unauthorized system or equipment modifications.
Sensors as a source of truth
Solar performance is not measured directly at the module level; it is inferred from sensor inputs. Metrics such as Performance Ratio (PR), expected vs. actual generation, and availability all depend on accurate irradiance and temperature data. When those inputs are inaccurate, observed performance deviations may reflect measurement error rather than true underperformance, leading to incorrect diagnoses and misaligned interventions.
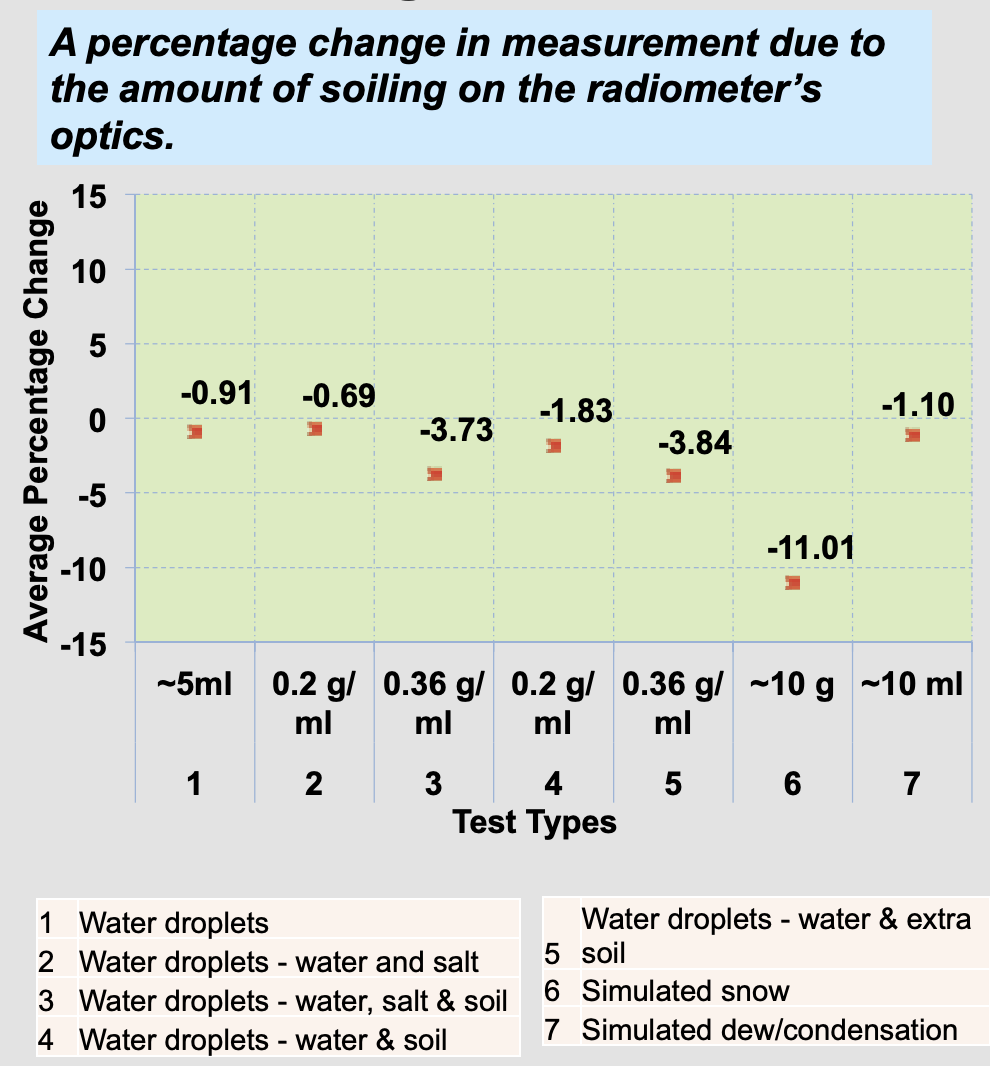
Over time, critical sensors, including irradiance sensors (pyranometers or reference cells) and temperature sensors, are exposed to dust, UV radiation, moisture, and general wear. Soiling of irradiance sensors in particular can introduce significant error: contamination reduces the optical transmittance of the pyranometer dome, directly lowering measured irradiance. NREL testing shows that soiling alone can reduce measured irradiance by approximately 0.2% to 27%, depending on the severity of contamination. These conditions cause readings to drift away from true values, even if the plant is operating as expected, introducing persistent error into performance measurement.
Even under normal conditions, measurement error can be material. High-precision pyranometers can drift by up to 2% per year, and baseline calibration differences across manufacturers can add another 1–2%. Together, these effects can result in readings that are off by as much as 4%, large enough to distort performance assessments, misattribute underperformance, and undermine the ability to substantiate warranty claims.
Standards such as IEC 61724 define monitoring system classes with requirements for accuracy, redundancy, and recalibration, but their effectiveness depends on consistent implementation and maintenance. Without regular calibration, cleaning, and validation, operators risk making decisions and pursuing claims based on inaccurate representations of asset performance.
Ensuring monitors are accurate requires:
- Perform regular cleaning of sensors, including pyranometers, PV reference cells, and other measurement devices, on at least a monthly basis. Use distilled water and a soft, lint-free cloth or swab to remove dust and contaminants that may affect readings.
- Verify sensor alignment and leveling, ensuring that all sensors remain level and correctly oriented, typically facing true north in the Northern Hemisphere and true south in the Southern Hemisphere.
- Inspect mounts and wiring, confirming that mounting hardware is secure, cables are undamaged, and cable shields are properly grounded to prevent signal interference.
- Maintain appropriate calibration intervals, calibrating sensors in accordance with manufacturer specifications to preserve measurement accuracy over time.
- Ensure proper drainage around sensors, particularly for dome-shaped pyranometers, to prevent water accumulation that may impact performance.
- Implement a standardized maintenance protocol, including monthly surface cleaning and visual inspections, quarterly checks for leveling and wiring (including debris removal), and annual comprehensive inspections to assess the need for repair or replacement.
- Plan for lifecycle costs, ensuring that operational budgets account for recurring calibration expenses and eventual sensor replacement at the end of service life.
- Incorporate data-driven inspection practices, analyzing historical performance data prior to major preventative maintenance activities to identify areas of concern, and using comparative analysis across similar power blocks to flag performance discrepancies.
Foundational relationships
When geotechnical data is not accurately translated into structural design, it can introduce persistent variability into foundation performance across a site that is difficult to detect and costly to correct post-construction. In utility-scale solar, this results in inconsistent pile embedment and tracker alignment, which distort system geometry, alter backtracking behavior, and increase row-to-row shading, ultimately leading to measurable energy loss and long-term stability issues.
The geotechnical engineer defines subsurface conditions and design parameters, while the engineer of record (EOR) translates those inputs into foundation and structural design. Misalignment often arises at this interface, where variability in soil conditions is simplified, misinterpreted, or unevenly applied across the site. As a result, final design assumptions may not fully reflect actual field conditions.
These gaps manifest in both cost and performance. Conservative assumptions can drive unnecessary material usage and increase upfront capital costs, while under-designed foundations are more susceptible to movement, settlement, or tilt over time. Even small deviations in alignment can disrupt tracker geometry, reducing the effectiveness of backtracking algorithms and increasing row-to-row shading. While subtle at the row level, these effects can accumulate across large arrays, resulting in persistent and measurable divergence from modeled performance.
On more complex sites, subsurface variability can lead to pile refusal or inconsistent embedment during installation, requiring field adjustments that introduce further variability across the system. These conditions reinforce alignment inconsistencies and increase the likelihood of localized performance losses. In more severe cases, structural issues may require pile remediation or replacement, resulting in downtime and repair costs that can reach into the hundreds of thousands of dollars.
Once introduced, these inconsistencies are difficult to correct and often persist for the life of the asset, creating system-wide variability that is not captured in initial design assumptions. What begins as a design-stage misalignment becomes a long-term operational constraint, affecting both performance and cost over the life of the project.
Effective coordination between geotechnical engineers and the EOR includes:
- Design-led investigation where the geotechnical engineer provides not only soil descriptions but also specific recommendations for shallow (concrete piers) or deep (driven or helical piles) foundations based on lateral and vertical loads defined by the structural EOR. For large sites with variable or inconsistent soil conditions, the number and distribution of borings and geotechnical evaluations should be increased.
- Pre-production testing (pile load testing) that evaluates the axial and lateral resistance of piles prior to final design, allowing embedment depths to be optimized and material usage to be reduced. Testing programs should cover the range of soil conditions and pile types present across the site.
- Corrosion mitigation through geotechnical assessment of soil resistivity to inform galvanization thickness or coating specifications developed by the structural team.
- Real-time construction coordination and change management where both the geotechnical engineer and structural EOR are included in RFIs related to foundation installation or changes in subsurface conditions, including pile refusal, as well as changes to topography, drainage, and other civil design parameters.
- Use of site-specific parameters by informing structural design with site-specific investigations, including borings, test pits, and resistivity testing, rather than relying on generalized assumptions.
The opportunity
As the utility-scale solar market expands into more diverse geographies and system configurations, performance outcomes are becoming less uniform and more dependent on execution.
These changes in siting and design contribute to wide performance dispersion: across nearly 1,500 projects studied by Berkeley National Lab, capacity factors average ~25% but range from ~7% to ~37%. While some of this variation is structural, a meaningful portion persists across otherwise similar assets.
For asset owners and investors, this dispersion reframes where value is created and lost. Performance is no longer determined solely at development or procurement, but continuously shaped by how effectively assets are managed, measured, and maintained over time. As portfolios scale and age, the ability to consistently execute across these dimensions becomes a primary driver of realized returns.
Enjoying this deep dive?
Stay up to date on market insights for teams who build, buy, and finance renewable projects.